Understanding Statistical and Practical Significance
What is Statistical significance?
Statistical significance is the probability that the result of a given study could have occurred purely by chance. It reflects the degree to which observed results are true. Hypothesis tests aim to determine if the observed difference is statistically significant.
What is practical significance?
Practical significance evaluates whether the observed difference is large enough to have any practical impact on a process under study. It evaluates the practical use of a study’s outcomes.
A hypothesis test evaluates statistical significance, whereas practical significance evaluates the significance of results considering all practical conditions. It is an inclusive decision for the process owner.

Explain the difference between statistical and practical significance
Statistical significance depends on small population differences and sample sizes, whereas practical significance looks at whether the difference is large enough to be a value in a practical sense.
Sometimes, a hypothesis test can find a claim to be statistically significant. However, a claim may not be worth the effort or expense to implement. Therefore, the organization should always consider practical significance along with statistical significance in a decision-making process. Analysts need to combine engineering judgment with statistical analysis.
Tags
Identify
The voice of the customer (VOC) is gathered and converted into technical requirements in this phase. A business case is then established and a project charter is prepared along with milestones. A team is also formed to carry out the project. Roles and responsibilities of the team members are also set during this phase. These activities are accomplished using tools such as Quality Function Deployment (QFD); Failure Modes and Effects Analysis (FMEA); the Suppliers, Inputs, Process, Outputs, and Customers (SIPOC) diagram; the Integrated Product Delivery System (IDPS); target costing; and benchmarking.
Design
In this phase, the concept design is developed by formulating alternative concepts and choosing the best concept after evaluating the alternatives. Risks associated with the chosen concept design are also determined. The functional requirements and their Critical to Quality (CTQ) attributes are identified by the Six Sigma team. The CTQ attributes are deployed after assessing their effect on functional requirements. Raw materials and their procurement plan with the related manufacturing plan are created during this phase. In addition, the Sigma capability is predicted. These activities are accomplished using tools such as smart simple design, risk assessment, FMEA, engineering analysis, materials selection software, simulation, DOE, systems engineering, and the capability of the process is evaluated to verify if the CTQs can be met.
Optimize
The design is optimized for reliability and performance by developing detailed design elements. This helps optimize the Sigma capability and cost. These activities are accomplished through manufacturing database and flowback tools, a design for manufacturability, process capability models, a robust design, Monte Carlo methods, tolerancing, and Six Sigma tools.
Validate
The prototype is tested using formal tools to validate the design. After evaluating the performance, failure modes, and risks of the design, new requirements to be met are sent to manufacturing and sourcing units. The design is iterated until it meets the requirements of the customer. A final phase review to assess the reliability is also carried out to validate the design. The term Verify is also used interchangeably for this phase. These activities are accomplished through accelerated testing, reliability engineering, FMEA, and disciplined New Product Introduction (NPI).
Tags
Organizations strive to eliminate three basic categories of waste in their business processes.
Basic Waste Category are:
- Wasteful activity – Work that adds no value to a product or service. Eliminating such activities from business processes will help organizations cut cost.
- Unevenness – This denotes inconsistencies that exist in a business process. Unevenness and inconsistencies can be avoided by eliminating inventory and supplying items to the production process only when they are needed.
- Overburden – This is caused by an unreasonable or excessive strain on resources. It can be eliminated by simplifying and standardizing processes.
Among these three basic categories of wastes, Lean focuses on eliminating activities that do not add any value. These activities are further classified into seven types of wastes: transport, inventory, motion, waiting, overproduction, over processing, and defects.
Tags
In a Lean manufacturing process, time and resources spent on conveying data and information are regarded as waste. Visual factory tools—such as signs, charts, check sheets, and more— simplify information and reduce resources and time consumed to make it accessible. Clear and concise real-time information and feedback regarding the status of a plant or a process is provided to shop floor employees using visual cues and tools. The visual cues provide unambiguous information needed to perform their jobs at a glance. Simple visual cues—such as color-coded pipes, wires, or flags; painted floor areas; and indicator lights—are simple to use and understand. The type of tool and the location used are determined by identifying the relevance and the information recipient.
Tags
Learn about the goals and principles of Lean in this article. Lean manufacturing has a few important goals, which have led many industries to implement lean in their production processes. The goals include:
- Improving quality to stay ahead of competition in the market. This is done by capturing customer requirements and redesigning operational processes to meet those requirements.
- Eliminating waste to make processes more efficient. This is done by eliminating activities that do not add any value to the product or service.
- Reducing variabilities and inconsistencies by standardizing processes and outputs.
- And, reducing costs by ensuring that production does not exceed customer demands. By preventing overproduction, organizations can also make sure that inventory costs do not increase.
The implementation of Lean techniques in an organization is guided by a few important principles.
|
Principle |
Description |
| Value | Defining the value |
| Value stream | Identifying the value stream |
| Flow | Creating flow in the value stream |
| Pull | Creating pull in the value stream |
| Perfection | Creating a continuous improvement culture |
| Leveling | Creating a balanced workflow |
| Standardized processes | Developing standards and following them |
| Kanban | Using a visual signaling system |
| Visual control | Using visual control methods |
| Quick changeover | Enabling the reduction of time |
| Defect prevention | Reducing the cost of poor quality |
Tags
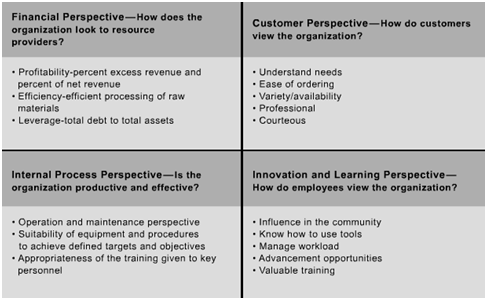
A Balanced Scorecard (BSC) is a strategic performance management framework for measuring the impact of strategic decisions across all organizational drivers of an organization. A BSC provides a wider perspective on strategic decisions made by an organization by measuring the impact on key business drivers such as finance, customer requirements, internal processes, innovation, and growth perspectives.
The BSC was conceived with the intent to overcome the limitations of traditional performance measurement tools. At the basic level, managers utilize it to track the activities of their direct reports and monitor the impact of their actions. At the decision-making level, a BSC is used both as a tool that facilitates strategic decision-making and as one that provides an insight into future performances.
Example of Balanced Scorecard?
An automobile manufacturer embraced BSC as a way to remain competitive in a rapidly evolving sector. The ensuing benchmarks show how BSC permeated into each department to coordinate the delivery of quality products and the ability to offer diverse models.


