Matrix diagrams can be sorted into several types depending on the number of data sets being compared.
- L-shaped Relates two sets of elements to one another or a single set of elements to itself.
- T-shaped Relates three sets of elements where there is no relation between the two sets that are related to a common set.
- Y-shaped Relates three sets of elements where one set is related to the other two sets in a circular manner.

- C-shaped relates three sets of elements simultaneously.
- X-shaped relates four sets of elements.
- Roof-shaped relates one set of elements to itself.
Tags
A matrix diagram, also called a matrix chart, is a management and planning tool used for identifying relationships between two to four groups of elements or among elements in a single group. The elements in different groups are placed in rows and columns and relationships among them are analyzed by the team. Symbols indicating the strength of the relationships are then entered in the cell where the row and column of the two elements intersect. If there is no relationship, then it is left blank. Because matrix diagrams help you analyze data, they are also extensively used in the Measure and Analyze phases of the DMAIC methodology.
- Relationships among different sets of items by comparing them, especially many-to-many relationships among them instead of one-to-one relationships.
- The strength of the relationship between different sets of items qualitatively.
- And, the success of a process that generates one set of items from another set of items.
Tags
In the previous topic, you created a tree diagram. Key issues identified must also be sorted in the order of their importance. A prioritization matrix helps determine the order for dealing with different issues or selecting solutions according to their relative importance. In this topic, you will create a prioritization matrix to identify crucial issues that require immediate attention.
You must prioritize key issues identified according to their importance to determine which issues or solutions are the most critical and need to be addressed first. Using a prioritization matrix, you can determine such crucial areas where Six Sigma projects need be implemented to improve your business processes.
What are Prioritization Matrices?
A prioritization matrix is a tool used for determining the most important issues or solutions. This tool can be used for any prioritization activity. In a Six Sigma project, it can be used for filtering or prioritizing either causes or solutions. For example, the cause-and-effect matrix is a prioritization matrix used for prioritizing causes, while the criteria-based matrix is used for prioritizing solutions.
Whatever the matrix, the procedure used for prioritization is the same. The Six Sigma team identifies different criteria to be used for measuring different solutions. The relative importance of each criterion is determined and a numerical value indicating the weight of each criterion is entered in a column. Ratings are then assigned to the solutions against different criteria. The different solutions are scored against the identified criteria. Each rating is then multiplied by the criteria weights to obtain the weighted scores. The weighted scores are then added to find the cumulative value. The option with the highest total value is regarded as the option with the highest priority.
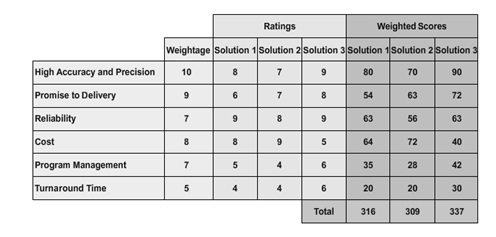
Fig: A sample prioritization matrix

What are the use of Prioritization Matrices?
- Prioritizing complex issues involving several criteria against which the issues are assessed.
- Assigning scores to the criteria or issues when data is available.
- Choosing key areas to be focused upon immediately.
- And, garnering team support and approval of crucial issues.
How to Create a Prioritization Matrix?
To create a prioritization matrix for determining key areas where Six Sigma projects need be implemented first:
- Gather the team members required to participate in the exercise.
- It is not necessary to limit the team to only the project team members.
- Involve all stakeholders who would have influence on the items to be prioritized.
- Ideally, the size of the team should be around eight.
- Agree upon the scope and the duration of the exercise because there is a tendency to drift from the main subject of interest, which may consume more time.
- Identify criteria against which the items to be prioritized can be weighed. Select the criteria according to your business and the nature of the process.
- Assign weights to the criteria on a scale of 1 to 10.
- Use an ascending scale while assigning the weight. Usually, the higher the better.
- Draw consensus within the team on the weights.
- Assign ratings for each item to be prioritized against different criteria on a scale of 1 to 10. Alternatively, the team can also pick solutions one by one and gather votes for each criterion. Members who agree that a solution fits a particular criterion vote for it. Ensure that necessary information is available to the team before voting.
- Compute the total score for each item.
- Multiply the rating for an item by the weight.
- Add the total scores for each item.
- Continue doing this for every criterion of all the items.
- Shortlist the items with higher scores for implementation.
Tags
An interrelationship digraph, also called a relations diagram or network diagram, is a tool that depicts relationships among different elements, areas, or processes through a network of boxes and arrows. It is usually used by Six Sigma teams to understand cause-and-effect relationships among different factors of a problem.
Tags
The metrics of a Six Sigma project reflect customer needs and ensure that the internal metrics of the organization are achieved. The selection of project metrics is one of the crucial elements in the Define phase of the Six Sigma methodology.
Six Sigma project metrics can be categorized into primary metrics and secondary metrics.
Primary Metrics
A primary metric, also called a project CTQ, is a CTQ measure that is used to monitor project progression and success. It is the reference point throughout the Six Sigma project. Ideally, project CTQs should have direct impact on customers. For any Six Sigma project, the primary metrics should be:
- Tied to the problem statement and objective of the project.
- In possession of an operational definition.
- Measurable, simple, and expressed in the form of an equation.
- Aligned to business objectives.
- Tracked on hourly, daily, weekly, and monthly basis.
- Expressed graphically over time with a run chart, time series, or control chart.
- And, validated with a Measurement Systems Analysis (MSA).
Some of the primary metrics of a Six Sigma project include customer satisfaction, on-time delivery of products, final product quality, and less costly products.

Secondary Metrics
A secondary metric, also known as a consequential metric, is a project metric that you do not want to sacrifice at the expense of primary improvements in a process. These metrics ensure that the process is improving and not shifting one metric at the expense of another. It means that the secondary metrics have a relationship with the primary metrics of a Six Sigma project. Therefore, the primary goal of a Six Sigma project will be to move the primary metrics, but ensure that secondary metrics do not deteriorate or stay constant. Some of the secondary metrics include cycle time, volume shipped, inspection data, and rework hours. These metrics should not be sacrificed to achieve the primary metrics such as customer satisfaction, on-time delivery of products, and final product quality.
Tags
A project charter is a contract between a Six Sigma project team and a sponsor. It provides a clear, concise description of the business needs that the project is intended to address. Any changes to the critical elements of a project charter need prior approval from the sponsor and consensus from the team members.

A completed sample project charter is available for download.
Click here to download here
Tags
Six Sigma projects are primarily focused on customers. The other areas that Six Sigma projects focus on are:

- Improving the performance of Critical to Quality (CTQ)
- Reducing the number of complaints from customers.
- Reducing in-process or internal defects.
- Reducing warranty claims.
- Improving survey and customer research scores.
- Capturing feedback from staff members effectively.
- Increasing profits and revenue.
- Improving audit scores.
- Improving process performance and dashboard metrics.
- And, having better growth than competitors.
Tags
Some of the major attributes of CTQ include:
- A single meaning for each metric across all geographic locations.
- Defining the process owners who are responsible for tracking the CTQ.
- Clearly defined defects and opportunities in the process.
- A consistent measurement system to provide accurate and precise measurements.
- And, it must be derived from the VOC so that it provides a strong linkage to the VOC.
Tags
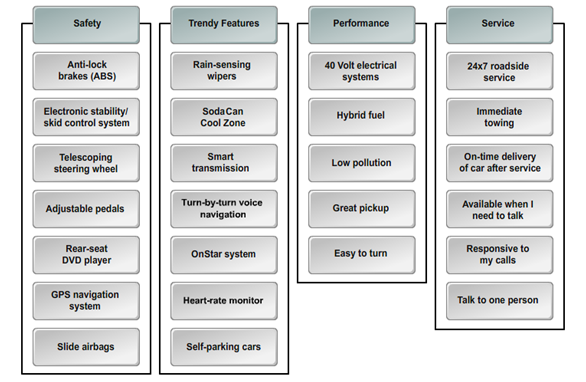
An affinity diagram is a tool that is used to organize a large number of ideas, opinions, and issues and group them based on their relationships. Affinity diagrams are generally used for categorizing ideas that are generated during brainstorming sessions and can be particularly useful for analyzing complex issues.

The steps for creating an affinity diagram can include:
- Generating ideas through brainstorming.
- Displaying the ideas randomly.
- Sorting the ideas into groups.
- Creating header cards for each group to capture the essential links among the ideas in each group.
- And, drawing the affinity diagram by writing the problem statement at the top and the headers with their respective groups of ideas below the problem statement.
- An affinity diagram helps in sorting and grouping customer requirements.
Tags
To gather the VOC, effective methods for accurately capturing customer requirements are required. Several methods are available to capture the VOC.
- Interviews are used to gather information from stakeholders by talking to them directly. Interviews aid in identifying and defining features and functions or desired project deliverables.
- Focus groups is a trained moderator-guided interactive discussion that includes pre-qualified stakeholders and subject-matter experts (SMEs) to elicit their expectations and attitudes toward the proposed product, service, or result of the project.
- Facilitated workshops is an interactive group-focused sessions that bring together key cross-functional stakeholders to define the project or product requirements. It is a primary technique to define cross-functional requirements and reconcile stakeholder differences to the project. Facilitated workshops occur much faster than individual discussions.
- Questionnaires and surveys is another method where written sets of questions designed to quickly gather information from a broad audience.
- Mystery shopping commonly performed in retail industries. This method is used to measure the quality of a service by gathering specific information about the product or service. This method is performed by mystery shoppers who introduce themselves as customers and perform specific customer-related tasks, such as purchasing a product and raising questions and complaints about the product.
- Observations are a direct way of viewing individuals in their work environment or while using the product to identify the project or product requirements. Also referred to as job shadowing.
- Market research is an organized effort to gather information about the current trends in an industry and also Field reports is a formal report documented by field engineers or other on-site personnel who gather required information about events that occur during their field work.
- Customer feedback and complaints data are used to gather customer requirements. This method also involves gathering customer feedback about the quality of a product or service. The consolidated list of feedback from customers is referred to as complaints data.
- Reliability data is a source of information that helps in analyzing the reliability of a product or process. By gathering this data, you can plan strategies to gain a reputation with customers as a reliable provider of services.
- Staff feedback is another method of gathering opinions from staff who interact with customers directly or who possess knowledge about customers and their expectations. This information is captured by conducting surveys, brainstorming sessions, and other information gathering sessions.
Tags
Most conventional organizations comprise departments and functions. A department head or functional head is responsible for all department deliverables. All department members should have clearly defined responsibilities for their respective tasks. Departmental tasks are expected to be performed on time and with quality. Every member of a department operates within a framework called a functional silo.
Functional silos focus on their own objectives alone and are not involved in interacting with other groups and sharing internal process information with others. Each department may also have several cross-departmental tasks that fall outside of the functional silo. Cross-departmental tasks can have delivery and quality issues. The boundary set up between functional and cross-departmental tasks brings about key challenges, including:
- Layers of bureaucracy that involve too many approvals.
- Lack of ownership in cross-departmental tasks.
- Management frustration due to lack of coordination among departments.
- Too many steps, such as checking and quality control, which are redundant for every department.
- Lack of focus on customers due to employee attention on internal tasks.
- And, opportunities for errors or corruption because of lack of ownership.

Cross-functional processes relate to a series of activities that are executed across an organization. Cross-functional processes are not organized by departments or functions, but by processes which comprise several departmental activities. In addition, cross-functional processes help clarify the end-to-end execution of a process. A cross-functional structure is a Six Sigma way of thinking how processes are structured and resources are aligned per key outputs. Therefore, a cross-functional structure facilitates better alignment to customer needs. Some of the benefits of a cross-functional process include:
- It becomes easy for top management to clarify its quality, cost, and delivery goals and deploy them to employees at every level.
- And, it facilitates close coordination among different departments in the organization.
Tags
QFD offers several benefits to organizations.
- It reduces design cycle time due to the decrease in design changes.
- It reduces the overall product development time because the focus is solely on satisfying key customer needs.
- It reduces overall cost by reducing design changes.
- It improves customer satisfaction because the development process is driven by the voice of the customer (VOC).
- It rates a product against other products in the market through competitor analysis.
- And, it documents identified competitive marketing strategies.
Tags
Quality Function Deployment (QFD) is a structured approach followed by customer-driven organizations to transform customer requirements into their product specifications.
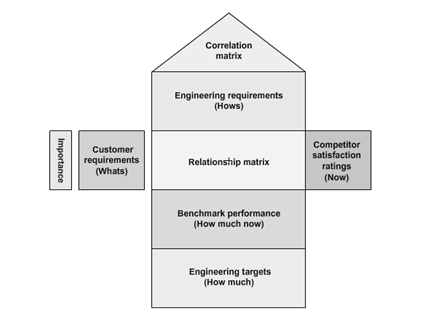
The House of Quality (HOQ) is a diagram used by a product development team during the initial stage of the QFD process.
It uses a planning matrix to define the relationship between customer requirements and the capability of the product and the company to satisfy these requirements. Because this matrix looks like a house, where customer requirements and product attributes resemble the main living quarters, competitive analysis resembles the porch, and the correlation matrix resembles the roof, it is called House of Quality.
HOQ encompasses different QFD elements used for understanding customer requirements and aligning business processes to meet these customer requirements.
It starts with customer requirements. The customers for a product or service are identified and their requirements from the product or service are gathered using different tools such as focus groups, surveys, and customer experiences. A structured list of customer requirements is then drawn by analyzing and organizing this data using tools such as affinity diagrams and tree diagrams.
Importance ratings are used for quantify the customer requirements and rated according to their importance on a scale of 1 to 5. This rating will be used in the relationship matrix at a later stage.
Another element is the Competitive analysis where customers views about the competition are gathered through research to provide a better understanding of the market. Here, the customers rate an organization’s products or services against competitors’ products or services. Also, Technical requirements that are not known to customers are identified and documented. These requirements generally stem from management or regulatory standards that a product must meet.

Relationship matrix defines the relationship between customer requirements and an organization’s ability to meet those requirements is determined. The relationship between the two factors is classified as weak, moderate, or strong and given the values of 1, 3, and 9, respectively. Even, in Importance weighting rating, Customer requirements are weighted according to their importance for defining and prioritizing key criteria. The relative importance of customer needs and the company’s and competitor’s performance are taken into account while calculating this. Target values for each product or service attributes, known as technical descriptors, that can be used as benchmarks against competitors’ target values are established. These target values are the “how much” of these product or service attributes.
The technical descriptors are compared with the competitors’ technical descriptors using scientific analytical techniques to assess their properties is called Engineering analysis. This also includes reverse engineering competitors’ products or services to determine the values for their technical descriptors. Correlation matrix is the relationship among customer requirements are analyzed to identify correlated requirements. The relationships are then ranked for determining areas of improvement that need to be focused upon.
Tags
DFSS and DMAIC are two of the methodologies commonly used by organizations to implement. Six Sigma. Organizations with well-developed Six Sigma programs also run DMAIC and DFSS projects concurrently.
| Feature | Description |
| Focus |
|