Cpm is yet another interesting process capability metric that is not very popular. In fact it is more robust than Cpk.
Cpm is an advanced measure and it corrects some deficiencies in Cpk. It is also called as Taguchi Capability Measure. In order for us to understand Cpm, let’s take a step back and understand Cpk.
Cpk
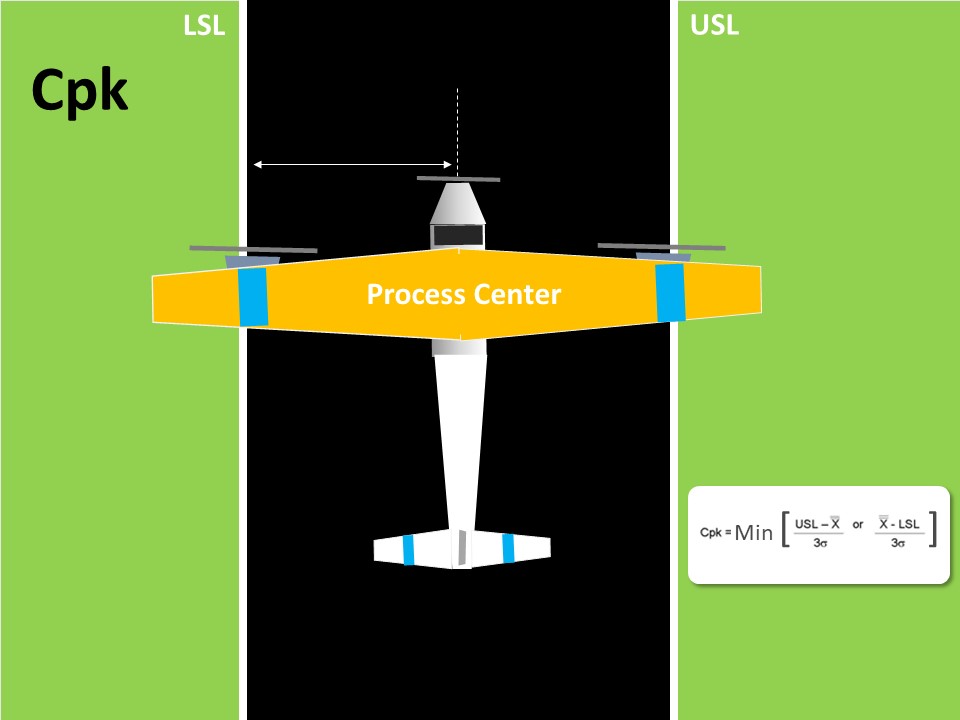
Cpk is considered as a measure of the process centering. If you closely observe the Cpk formula, it doesn’t take the actual Target value. Target Value is the center value obtained from customer specification.
However it takes the lowest value of (USL – Process Mean) and (Process Mean – LSL). In a way, this is an indirect method of assessing if the process centered to the tolerance.
As an analogy, in order to know if the plane is landing exactly on the middle of the landing strip, we look at the distance of the plane’s nose from either edge of the strip. That is good but it’s only an indirect way of assessing the process center.
Now it’s look at Cpm and then draw comparisons.

Cpm
If you look at the formula of Cpm, it contains the target value. Thus in addition to obtaining the USL and LSL from the customers, we also obtain the Target value.
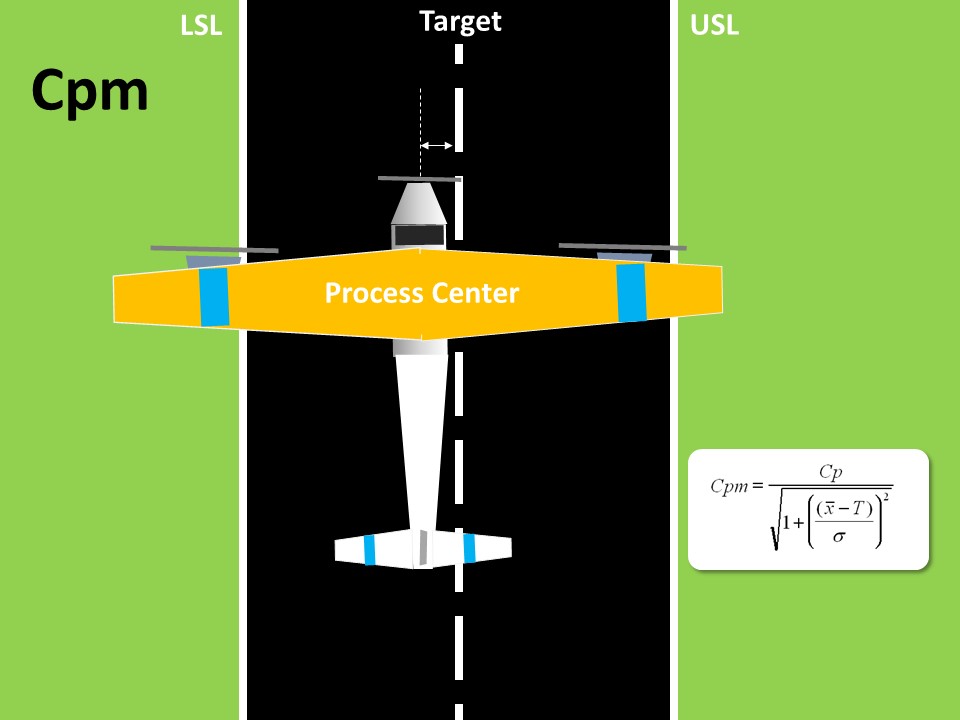
This means, Cpm is a true process centering capability index, because it compares the difference between process mean and target value. To draw an analogy to plane landing, we are comparing the plane nose to the median line of the strip.
Let’s now take a few scenarios to compare Cpk and Cpm values.
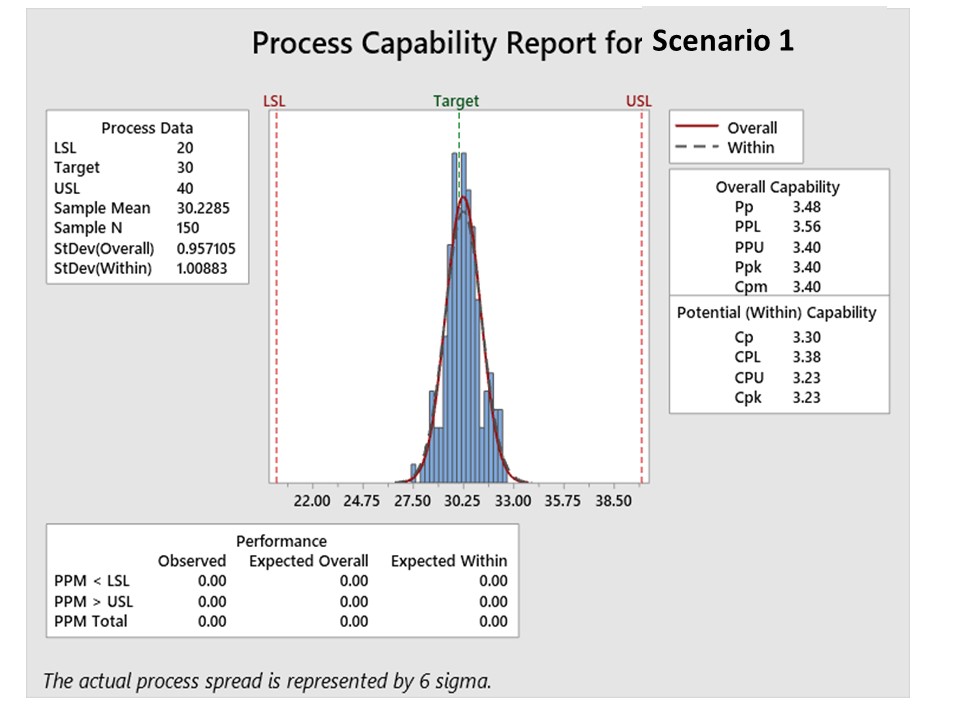
Cpk and Cpm Scenario 1
Process is centered, mean and target are close to each other. Cpk and Cpm are high and nearly the same.
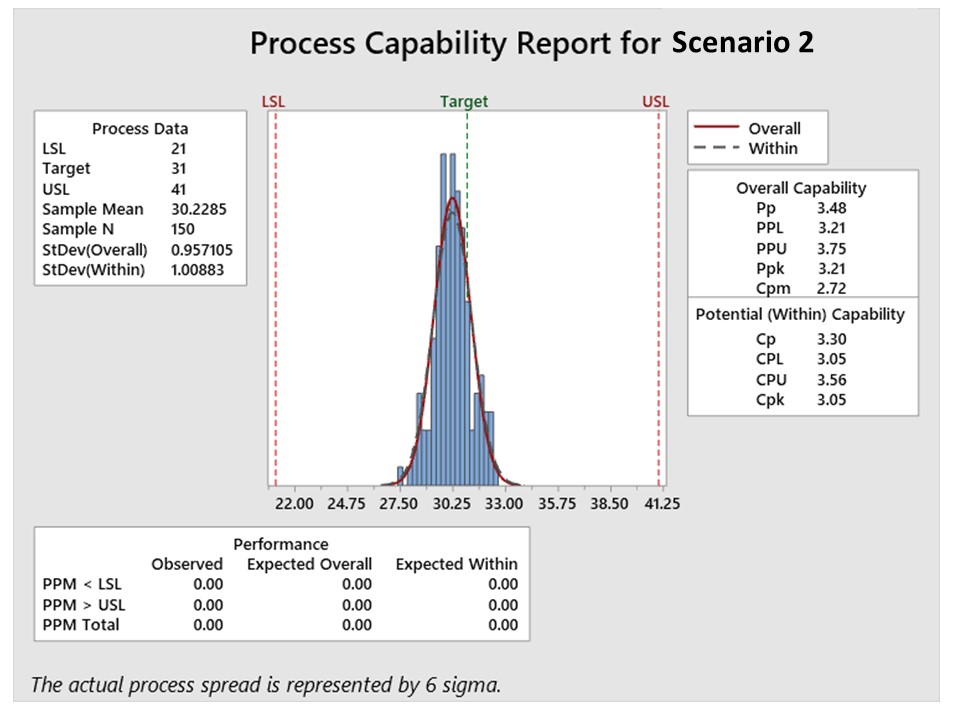
Cpk and Cpm Scenario 2
Process is not centered and Cpk & Cpm both have reduced.
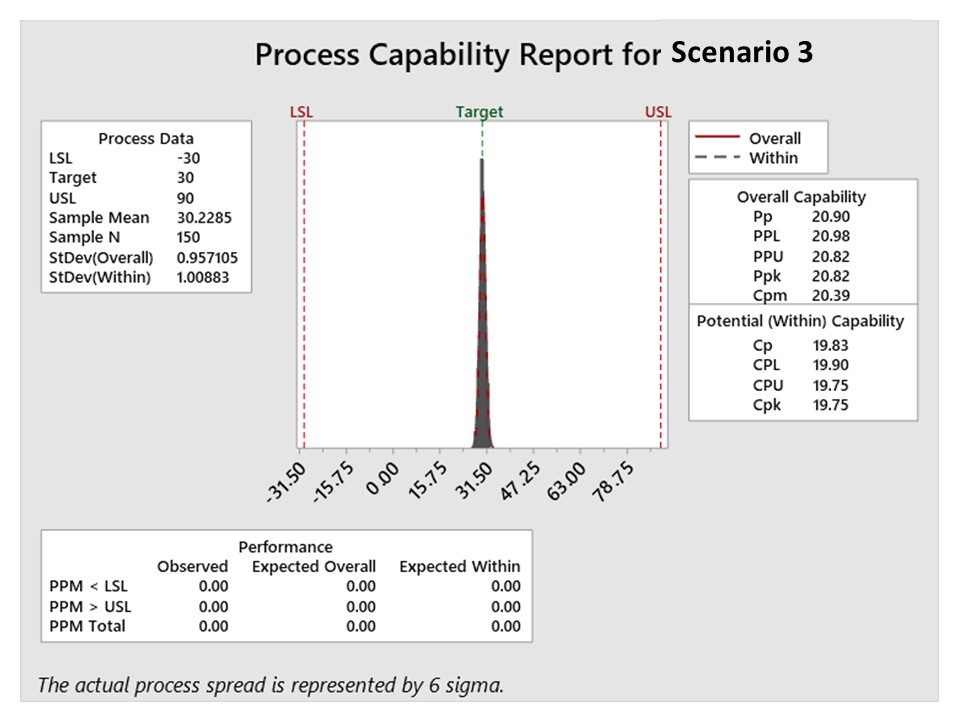
Cpk and Cpm Scenario 3
Process is centered but tolerance is liberal. Thus Cpk and Cpm values are very high.
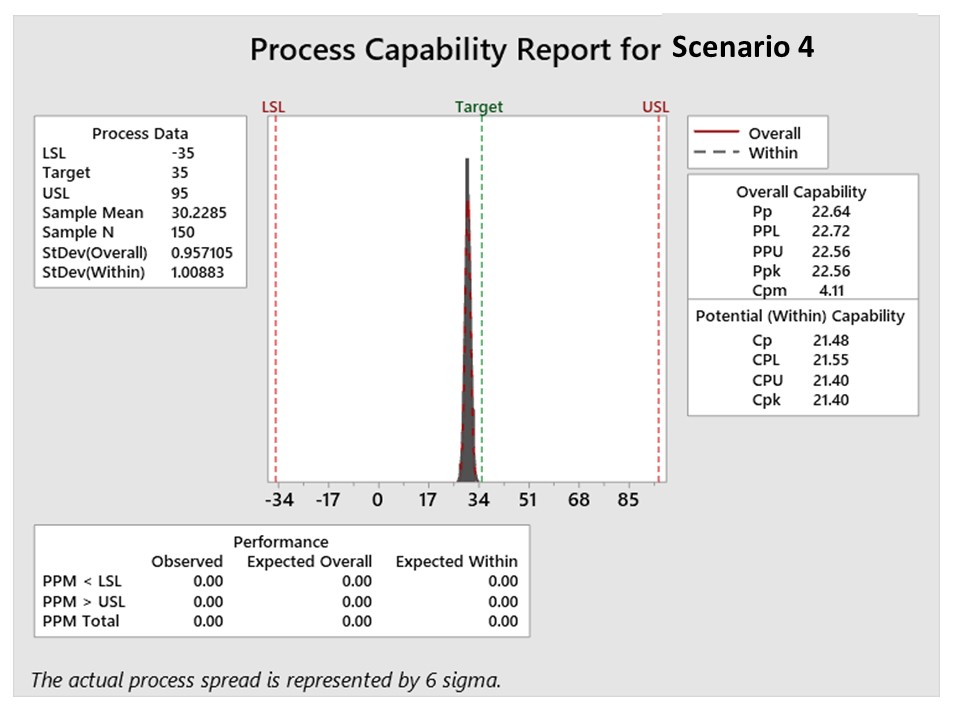
ScCpk and Cpm Scenario 4
Out here, the process has liberal tolerance but a meagre shift from the target. In this scenario Cpk value hasn’t really dropped much, but Cpm has crashed down. While this example is an extreme scenario with very liberal tolerance, it’s meant to illustrate the fact that Cpm is very sensitive to even small shift in mean from center, while Cpk isn’t.
Cpk and Cpm Scenario 5
In this case, there is only a specification on one side. In most business processes, Service Levels have only an upper or lower specification. In some cases, Cpk looses its significance. However, in all service scenarios, there is a target value. For ex: customers are told that payment will be updated in 4 hours but the internal target is to get it done in 2 hours. Process is capacitized for 2 hours. In also such scenarios Cpm will be a relevant centering metric.
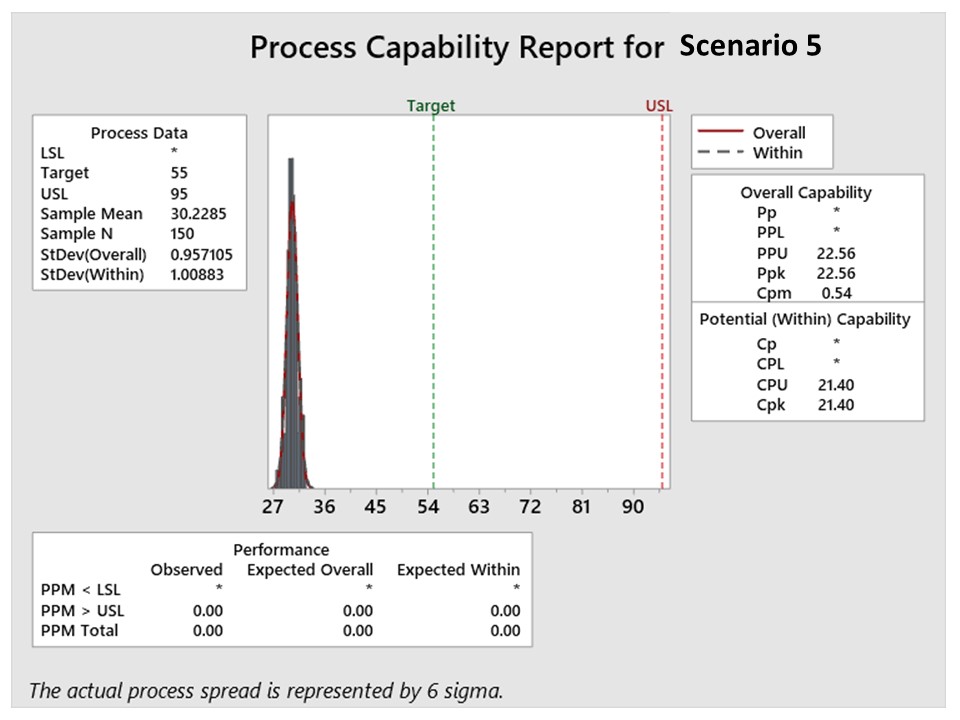
In this scenario, Cpk is high but Cpm isn’t. This Cpm is a good capability measure for one sided tolerances.
Cpk and Cpm Scenario 6
This is a unique case, where the Target isn’t the center of tolerance. This situation can occur in process industries and for certain critical dimensions where we intentionally set the process not at the center but to one side (such as to offset for tool wear in grinding).
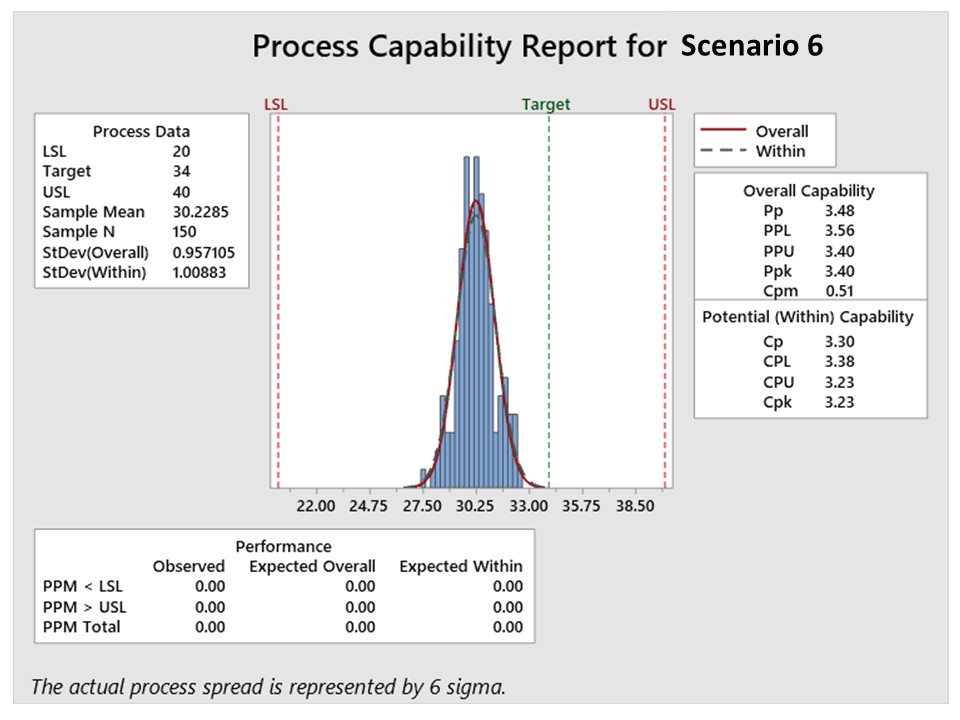
From the above 6 scenarios, it is clear the Cpm is a robust process centering capability index which can be used to evaluate process shifts, drifts, one-sided specifications and non-centered specifications.
To further get some hands-on practice, try drawing the following values in paper and then calculated CpK and Cpm.
usl = 30, lsl = 6, Target = 18, Mean = 10, SD = 0.6
Tags
Any aspirant preparing for Lean Six Sigma Certification Exams of ASQ or IASSC, it is important for you to understand the difference between CTQ, Primary Metric and Secondary Metric.
In Lean Six Sigma, the term CTQ is very commonly used. CTQ is an acronym Critical to Quality. As the name suggests, any attribute, parameter, factor or metric that is critical to the quality of the product or service you are offering to your customers can be considered as CTQ.
One important element of CTQ is that it should be measurable, directly or indirectly. As we all know, anything that cannot be measured, cannot be achieved. More or less, it is difficult to maintain the desired level of quality for any product or service, if an important or critical attribute is not measured.
In the context of improvement projects in Lean Six Sigma, using the framework of DMAIC, the objective of such projects will be for Lean Six Sigma Green Belt or Lean SIx Sigma Black Belt will be to improve a given CTQ. For example, if on time delivery could be a CTQ for the business because the customer wants your products or service on-time. Thus CTQ emanates from the customer. There are usually many CTQs for any product or service. But the DMAIC Project will have to focus on improving only CTQ at a time. Especially the one which is not performing up to the mark, as desired by customers. This becomes the primary metric of the project. In this example, On-time delivery could be a Primary Metric. The purpose of the project will now be fully aligned to improve this primary metric.
If that is the primary metric, the question we need to answer is what is a secondary metric in a Lean Six Sigma Improvement project? To understand how to identify secondary metric, we will take a step back and talk about the purpose of improvements in using Lean Six Sigma or any other structured problem solving approach.
Purpose of Using Structured Framework like Lean Six Sigma DMAIC for Problem Solving
There are many benefits of using such a framework, but come to the most pertinent point. Any improvement that is brought about by compromising or reducing the performance of any aspect of the business, product or service is not real improvement. It is mere optimization and doesn’t need problem solving skills. For example, if one adds more employees, equipment or cost to reduce the on-time delivery, that isn’t true improvement.
Hence we will need to ensure that Cost of Servicing and Quality of Service does not deteriorate as we try to improve On-time delivery.
These become Secondary Metrics for the project. Thus Secondary Metrics are those parameters or CTQs that will be monitored and sustained at current level, as we try to improve the primary metric. Secondary Metrics are also called Consequential Measures or Counter-measures.
While any DMAIC project should ideally have only one Primary Metric, it can have as many secondary metrics. All secondary metrics will be monitored and throughout the project, care will be taken to ensure there are no side effects on the Secondary Metrics as a result of any improvement in Primary metric.
The best way to identify secondary metrics will be through brainstorming. An alternate way would be to look for statistical relationships between various CTQs.
Tags
This Lean Six Sigma Free Course on Lean Six Sigma of 16 lectures and 2 hours of content
Course Features
• Apt for beginners to understand the power of Lean Six Sigma
• Covers the principles and tool applications
• Types of Certifications and its relevance
• On completion of Test, receive free Certificate
Access our Our Digital Learning Portal Click Here
This Lean Six Sigma Green Belt Online Certification Course contains 180 Lectures as ASQ and IASSC BoK.
Course Features
• Obtain GB Certification from CBMG
• Covers industry examples from IT, ITES, Manufacturing
• Step-by-Step Procedure of Analysis covered in Minitab for GB Tools
• Case Studies Minitab Files available for download
• Crisp Notes for each Chapter can downloaded
• Quiz with over 200 questions added
Access our Our Digital Learning Portal Click Here
Tags
This is a Lean Six Sigma Green Belt Course which uses Python for Data Analysis instead of Minitab
Course Features
• Obtain GB Certification from CBMG
• Covers industry examples from IT, ITES, Manufacturing
• No prior experience of Six Sigma or Python programming needed
• Step-by-Step Procedure of Analysis covered in Python or GB Tools
• Case Studies Python Files available for download
• Crisp Notes for each Chapter can downloaded
• Quiz with over 200 questions added
Access our Our Digital Learning Portal Click Here
This Lean Six Sigma Black Belt Online Certification Course contains 250 Lectures as ASQ and IASSC BoK.
Course Features
• Obtain BB Certification from CBMG
• Covers industry examples from IT, ITES, Manufacturing
• Step-by-Step Procedure of Analysis covered in Minitab
• Case Studies Minitab Files available for download
• Crisp Notes for each Chapter can downloaded
• Quiz with over 150 questions added
Access our Our Digital Learning Portal Click Here
This contains 2 practice tests designed exactly same as ASQ guidelines and useful for exam preparation
Course Features
• 2 Online Practice Test Sample Test Papers for ASQ GB Certification
• 100 Questions in each Paper
• Difficulty level similar to ASQ
• Exam Preparation Tips
• DMAIC Phase-wise Deliverables – Refresher
• LSS Case Study included
Access our Our Digital Learning Portal Click Here
This contains 2 practice tests designed exactly same as IASSC guidelines and useful for exam preparation
Course Features
• 2 Online Practice Test Sample Test Papers for IASSC GB Certification
• 100 Questions in each Paper
• Difficulty level similar to IASSC
• Exam Preparation Tips
• DMAIC Phase-wise Deliverables – Refresher
• LSS Case Study included
Access our Our Digital Learning Portal Click Here
This Lean Six Sigma Yellow Belt Online Certification Course contains 28 Lectures .
Course Features
• Obtain YB Certification from CBMG
• Knowledge of Lean and Six Sigma Tools that can be applied to real situations
• Six Sigma Case Study dealt in detail for a project scenario
• Covers industry examples from IT, ITES, Manufacturing
• Crisp Notes for each Chapter can downloaded
Access our Our Digital Learning Portal Click Here
Six Sigma Professionals to upgrade their knowledge and learn to use Python to perform Six Sigma analysis.
Course Features
• 30 Lectures with 5 hours of content
• Detail step by step procedure to use Python for all Six Sigma Analysis
• No prior programming experience needed
• Python code and dataset provided with course
Access our Our Digital Learning Portal Click Here
The is a foundation course on FMEA and Risk Management which offers 20 lectures and 2 hours of content
Course Features
• Covers basic concept of Risk Management
• Need for FMEA and various concepts involved in FMEA
• Step by Step procedure to complete FMEA
• Includes FMEA Template
Access our Our Digital Learning Portal Click Here
AIAG/VDA has updated FMEA format and the latest FMEA concepts are covered in this course
Course Features
• Changes to existing FMEA templates a suggested by AIAG/VDA
• 3 Case Studies, 1 each for DFMEA, PFMEA and FMEA MSR
• New 7-Steps approach
• Cascading and Linking DFMEA, PFMEA and FMEA MSR
• Application of Five-T’s during planning phase
• Usage of Action Priority Tables
• How to develop FMEA – MSR
Access our Our Digital Learning Portal Click Here
Design of Experiment (DOE) in structured experimentation techniques using Statistical methods that helps Product Engineers to develop and refine designs. This course is for Product Engineers and contains 20 lectures.
Course Features
• Introduction of DOE
• Performing Factorial Designs
• Performing Fractional Factorial Designs
• Performing Taguchi Design
• Minitab Step-by-Step procedure
Access our Our Digital Learning Portal Click Here
MSA – Measurement System Analysis. This course will help you to assess the reliability of your Measurement System and apply your knowledge to improve measurement process thereby improve your quality of product/process in 10 lectures.
Course Features
• Elements of MSA
• Resolution & Accuracy
• Precision
• Gage R&R
• MSA Kappa
• MSA ANOVA
Access our Our Digital Learning Portal Click Here
